Brazil won the continuous casting race. It is not in the next one
In 1990, Brazil continuously cast 58% of its steel, against South Korea's 96%. Today it casts 99.6% — ahead of Korea. The gap closed and reversed. But when you look for Brazil in the table of the technology that defines today's industrial frontier, something other than being behind happens: it is not in the table.
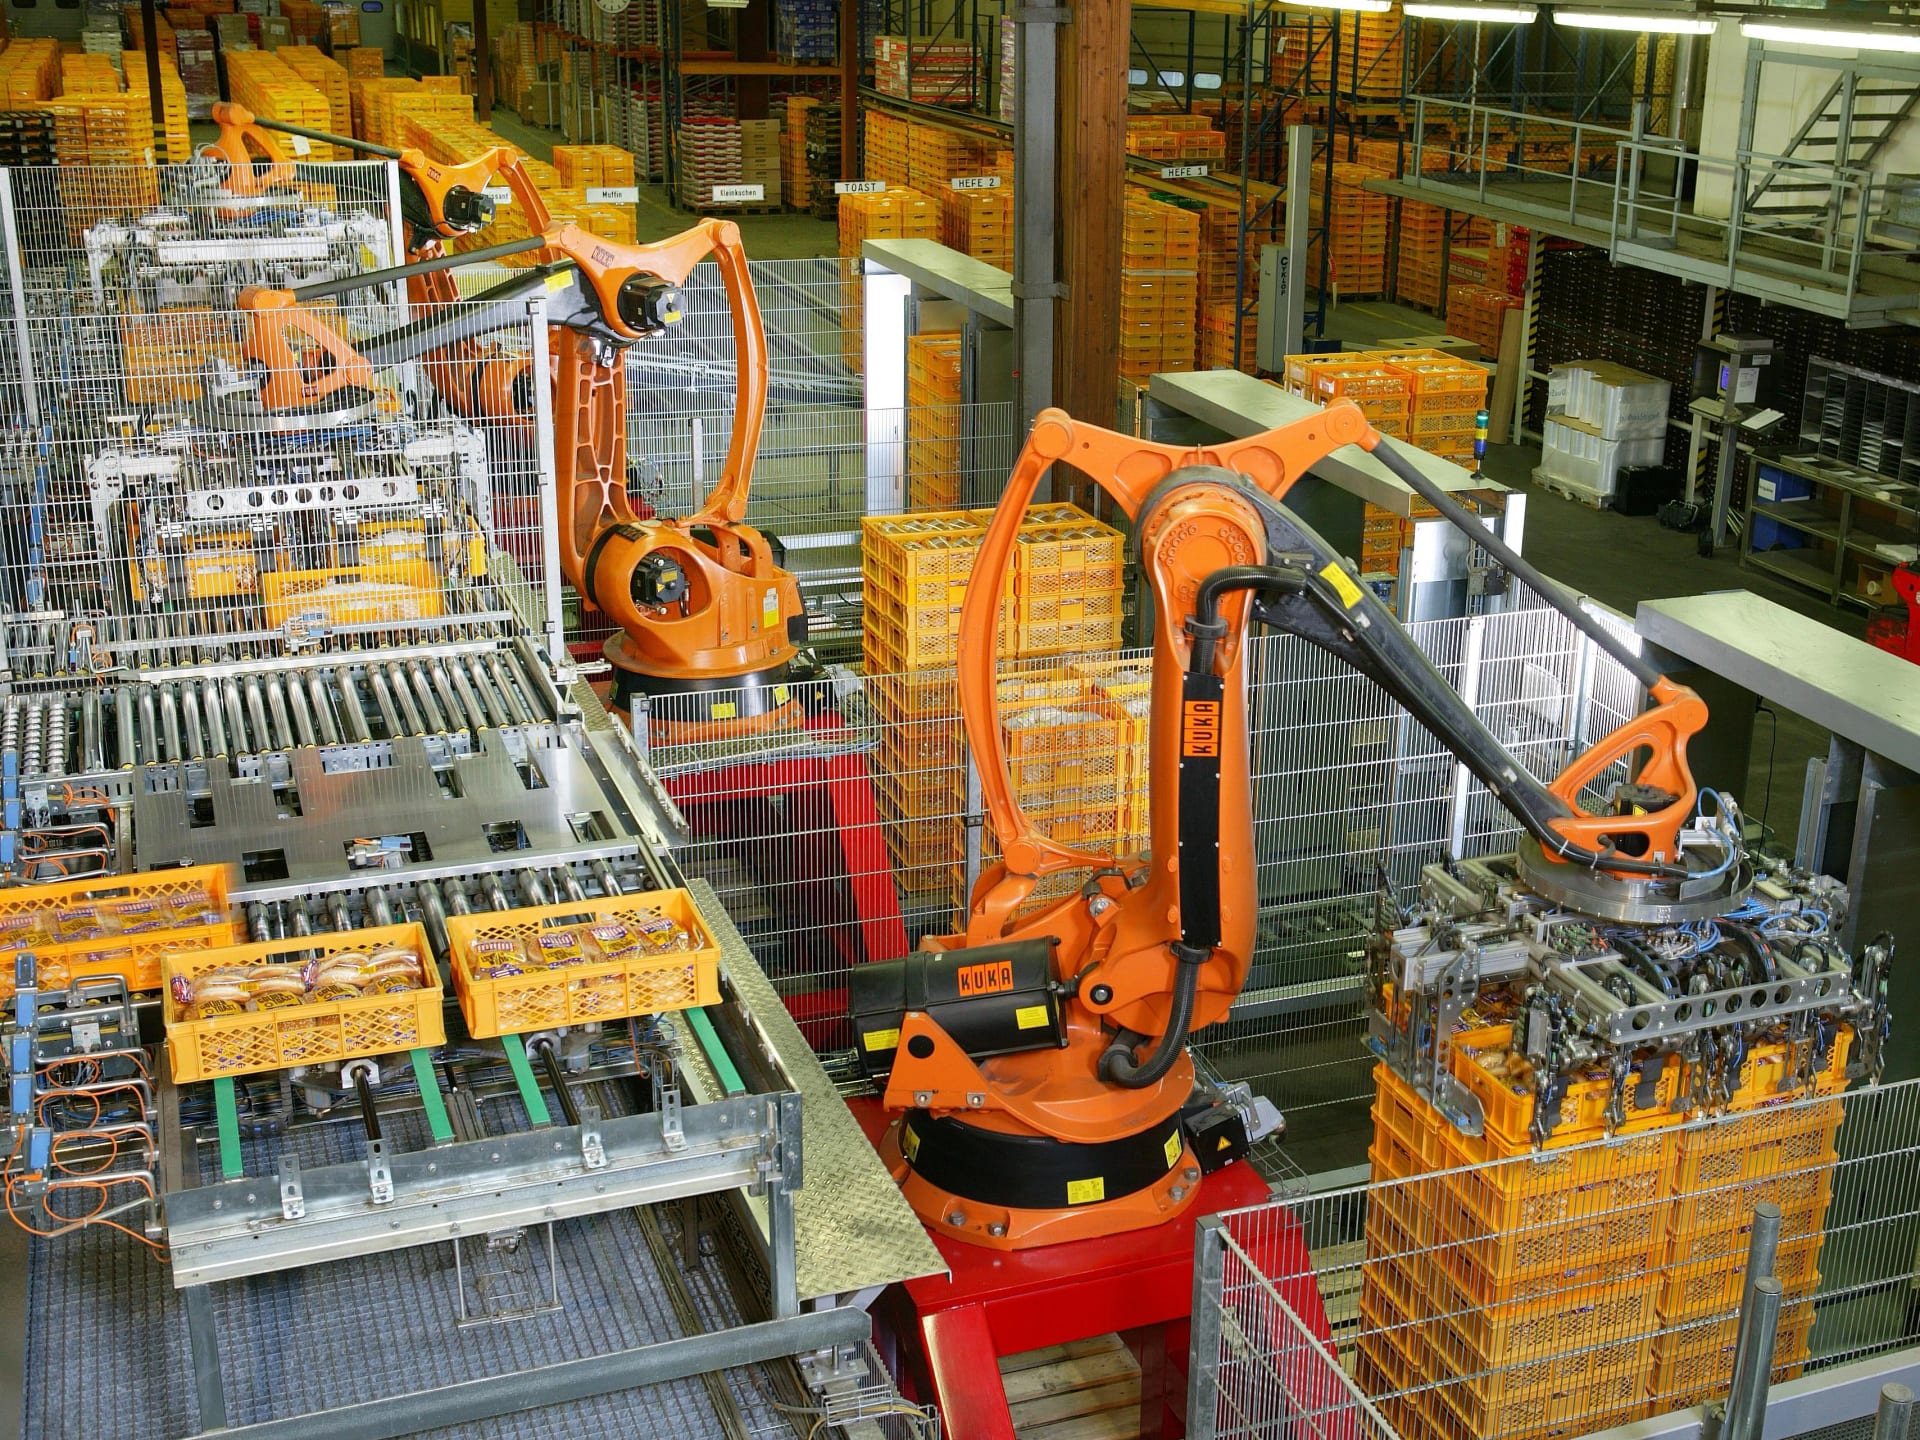
Every technological race has a number that sums it up. In the 1980s, in steelmaking, that number was the share of crude steel processed by continuous casting — the technique that eliminates an entire stage of production, saves energy, and improves metal yield.
The article that gave rise to this investigation used that number to show who was actually running: South Korea went from around 20% in 1975 to 96% in 1990. Brazil, which started out alongside it, reached 58% that same year.
Thirty-five years later, it is worth checking the scoreboard.
The gap did not close. It reversed
| Country | 2023 | 2024 | 2025 |
|---|---|---|---|
| Brazil | 98,2% | 99,5% | 99,6% |
| Japan | 99,1% | 99,1% | 99,1% |
| China | 98,4% | 98,4% | 98,3% |
| South Korea | 98,1% | 98,4% | 98,2% |
| Total of countries in table | 97,5% | 97,5% | 97,4% |
Brazil continuously casts 99.6% of its crude steel. South Korea, 98.2%. The country that was 38 percentage points behind in 1990 is today a point and a half ahead.
Before this turns into a story of triumph over adversity, it is worth reading what that number actually means. Continuous casting has become the world standard: the average of the countries that produce practically all the steel on the planet is 97.4%. Reaching 99.6% is not leading a frontier. It is having finished crossing a bridge that everyone crossed.
What the figure proves is more modest and still relevant: Brazilian industry is capable of closing a technological gap when closing it becomes a condition of existing in the market. It is not a problem of capacity. It was a problem of timing.
What today's continuous casting is
If the question is where the frontier lies today, the most heavily measured candidate is industrial robot density: how many robots are in operation per 10,000 manufacturing workers. The International Federation of Robotics (IFR) publishes the series by country.
Industrial robots in operation per 10,000 manufacturing workers (2024)
Ver os dados
| Country | Robots per 10,000 workers |
|---|---|
| South Korea | 1.220 |
| Singapore | 818 |
| Germany | 449 |
| Japan | 446 |
| United States | 307 |
| Canada | 241 |
| China | 166 |
| World average | 132 |
| Mexico | 62 |
South Korea leads with 1,220 robots per 10,000 workers — more than nine times the world average of 132. It is the same country that, in the original article, appeared buying equipment at international prices while Brazil paid a premium for domestically made machinery.
And here this article runs into a limit
The obvious question is: how many robots per 10,000 workers does Brazilian industry have?
It was not possible to answer with a verifiable source. Brazil does not appear in the country table of the IFR release — which lists twelve countries and three regional averages — it does not appear in the dataset that Our World in Data publishes from the same source (41 countries), and the full World Robotics report is paid. The only Latin American country in the table is Mexico, with 62.
This article could have estimated the number. It chose not to. An invented figure about industrial automation would be worse than its absence, because it would circulate with the appearance of a measurement.
The absence, however, is itself a piece of data — and it is the finding of this investigation. The IFR series is built from information supplied by national robotics associations and by manufacturers. Being outside the country table means that Brazil is not large enough in the global industrial robot market to figure among the twelve reported, nor does it have anyone reporting it with the regularity the ranking requires. In 1975, when Korea was continuously casting 20% of its steel, it was in the table. Behind, but inside.
The difference between being behind in a table and not being in the table is the difference between losing a race and never having entered it.
What changes in the reading
The original article showed a Brazil that arrived late to technology because it did not need to arrive on time: with the domestic market guaranteed and profit subsidized from another source, running was optional. Continuous casting is the proof that, once it stopped being optional, the country ran — and overtook.
The reading this investigation proposes, which belongs to Sip Dölyn and not to the thesis, is that the pattern repeats with a built-in delay of one generation. Brazil finishes the previous races competently. The problem is that the frontier has already moved by the time it gets there — and at the moment a technology becomes a condition of existing, whoever started twenty years earlier is no longer competing for the same prize.
Publishing Brazil's robot density, with a methodology comparable to the IFR's, would cost an industry association less than a business-cycle study. Until that exists, the only thing that can honestly be said about Brazil's position on today's industrial frontier is that no one is measuring it.
- automation
- industrial robots
- steel industry
- productivity
- south korea
- brazil
- industrial technology
Where this investigation came from
This story grew out of a question raised while we were producing The Steel Mill the World Bank Said Should Not Exist.
Referências
- World Steel Association (worldsteel). World Steel in Figures 2026 — Continuously-cast steel output, 2023 to 2025. World Steel Association. 2026 Acessar
- International Federation of Robotics (IFR). World Robotics 2025 — Robot density in the manufacturing industry. International Federation of Robotics. 2026 Acessar
- Our World in Data. Industrial robots in operation per 1,000 employees (a partir de dados da IFR). Our World in Data / University of Oxford. 2025 Acessar